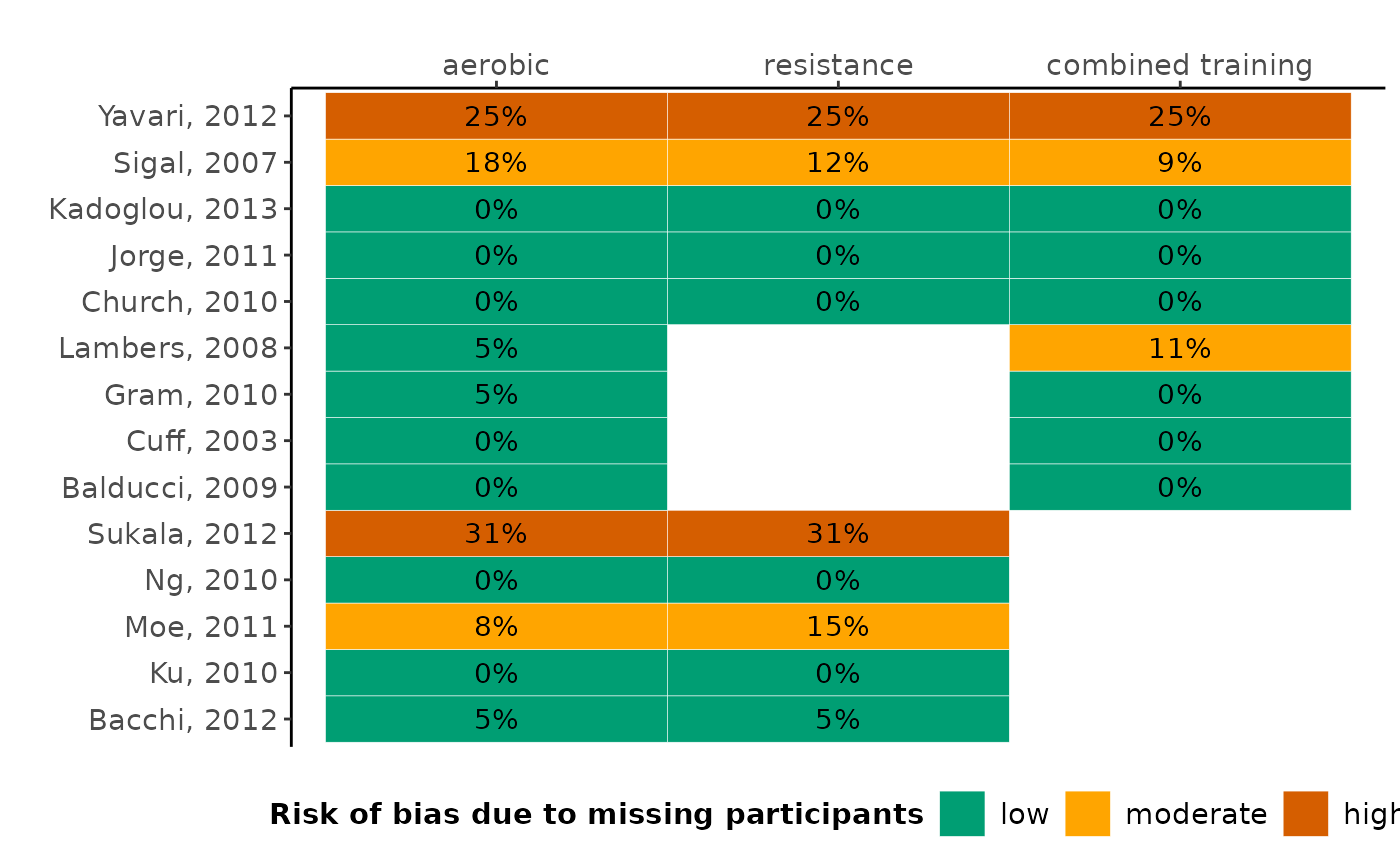
Heatmap of proportion of missing participants in the dataset
Source:R/heatmap.missing.dataset_function.R
heatmap_missing_dataset.RdIllustrates the proportion of missing participants and the associated risk of bias in each arm of every trial in the dataset.
Arguments
- data
A data-frame of a one-trial-per-row format containing arm-level data of each trial. See 'Format' in
run_model.- trial_names
A vector of labels with the name of the trials in the order they appear in the argument
data.- drug_names
A vector of labels with the name of the interventions in the order they appear in the argument
data.
Value
A heatmap presenting the proportion of missing participants in each trial-arm of the dataset. The columns and the rows of the heatmap correspond to the interventions and trials, respectively. The 'five-and-twenty' rule of Sackett and colleagues (1997) is used to characterise the proportion of missing participants as being associated with low (up to 5%), moderate (more than 5% and up to 20%), and high risk of bias (more than 20%). Low, moderate, and high risk of bias due to missing participants are indicated using green, orange, and red colour, respectively. The function is also applicable for a pairwise meta-analysis. If missing participants have not been reported for a trial-arm, the corresponding cell is indicated in grey.
Details
When the number of missing participants has not been extracted for any arm of the trials, the execution of the function will be stopped and an error message will be printed on the R console.
When there are more than 80 trials, the value on the proportion of missing participants will not appear on the heatmap. This is because the number on the cells will not be distinguishable.
References
Sackett DL, Richardson WS, Rosenberg WM, Haynes RB. Evidence-based medicine: how to practice and teach EBM. New York: Churchill Livingstone 1997. ISBN: 0-443-05686-2.
Examples
data("nma.schwingshackl2014")

# Return the first six trials of the dataset
head(nma.schwingshackl2014)
#>            study t1 t2 t3    y1    y2 y3  sd1  sd2 sd3 m1 m2 m3 n1 n2 n3
#> 1   Bacchi, 2012  1  2 NA -0.40 -0.35 NA 0.44 0.48  NA  1  1 NA 20 20 NA
#> 2       Ku, 2010  1  2 NA -0.60 -0.30 NA 1.20 0.90  NA  0  0 NA 15 13 NA
#> 3      Moe, 2011  1  2 NA -0.53 -0.35 NA 0.45 0.40  NA  1  2 NA 13 13 NA
#> 4       Ng, 2010  1  2 NA -0.30 -0.40 NA 0.88 0.60  NA  0  0 NA 30 30 NA
#> 5   Sukala, 2012  1  2 NA -0.10 -0.10 NA 0.51 0.93  NA  4  4 NA 13 13 NA
#> 6 Balducci, 2009  1  3 NA  6.34  6.65 NA 0.94 1.08  NA  0  0 NA 20 22 NA

# The names of the interventions in the order they appear in the dataset
interv_names <- c("aerobic", "resistance", "combined training")

# Create the heatmap
heatmap_missing_dataset(data = nma.schwingshackl2014,
                        trial_names = nma.schwingshackl2014$study,
                        drug_names = interv_names)