Barplot for the Kullback-Leibler divergence measure (missingness scenarios)
Source:R/KLD.barplot_function.R
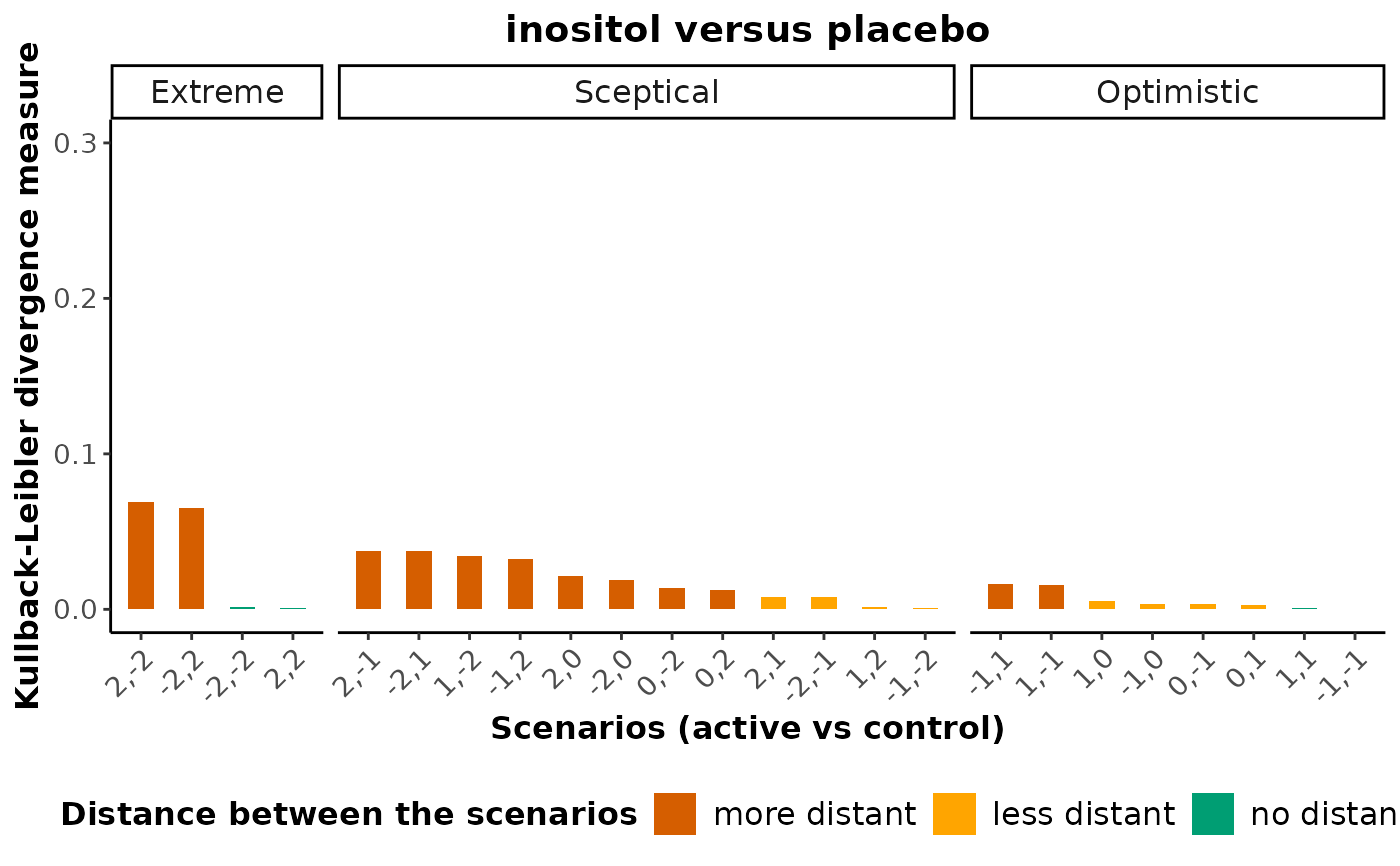
kld_barplot.RdProduces a barplot with the Kullback-Leibler divergence measure
from each re-analysis to the primary analysis for a pairwise
comparison. Currently, kld_barplot is used concerning the impact of
missing participant outcome data.
Arguments
- robust
An object of S3 class
robustness_index. See 'Value' inrobustness_index.- compar
A character vector with two elements that indicates the pairwise comparison of interest. The first element refers to the 'experimental' intervention and the second element refers to the 'control' intervention of the comparison.
- drug_names
A vector of labels with the name of the interventions in the order they appear in the argument
dataofrun_model. Ifdrug_namesis not defined, the order of the interventions as they appear indatais used, instead.
Value
kld_barplot returns a panel of barplots on the
Kullback-Leibler divergence measure for each re-analysis.
Details
kld_barplot uses the scenarios inherited by
robustness_index via the run_sensitivity
function. The scenarios for the missingness parameter (see 'Details' in
run_sensitivity) in the compared interventions are split to
Extreme, Sceptical, and Optimistic following the
classification of Spineli et al. (2021). In each class, bars will green,
orange, and red colour refer to scenarios without distance, less distant,
and more distant from the primary analysis
(the missing-at-random assumption).
kld_barplot can be used only when missing participant outcome
data have been extracted for at least one trial. Otherwise, the execution
of the function will be stopped and an error message will be printed on
the R console.
References
Kullback S, Leibler RA. On information and sufficiency. Ann Math Stat 1951;22(1):79–86. doi: 10.1214/aoms/1177729694
Spineli LM, Kalyvas C, Papadimitropoulou K. Quantifying the robustness of primary analysis results: A case study on missing outcome data in pairwise and network meta-analysis. Res Synth Methods 2021;12(4):475–90. doi: 10.1002/jrsm.1478
Examples
data("pma.taylor2004")

# Read results from 'run_sensitivity' (using the default arguments)
res_sens <- readRDS(system.file('extdata/res_sens_taylor.rds',
                    package = 'rnmamod'))

# Calculate the robustness index
robust <- robustness_index(sens = res_sens,
                           threshold = 0.17)
#> The value 0.17 was assigned as 'threshold' for standardised mean difference.

# The names of the interventions in the order they appear in the dataset
interv_names <- c("placebo", "inositol")

# Create the barplot for the comparison 'inositol versus placebo'
kld_barplot(robust = robust,
            compar = c("inositol", "placebo"),
            drug_names = interv_names)